New in CloudTables:
Bar display and easier nesting of data
With our latest release of CloudTables, we've introduced a number of new features that I would like to introduce to you:
- Bar display of numbers
- Google Sites embed
- Improved linked data visualization
Bar display of numbers
First up is the new ability to display number data points as bars, with customization control over a gradient color used for the bars (based on their value) and also manual control or automatic detection of the max / min range to be used for the bars.
Below is an example CloudTable based on the CPU performance of various laptops as reported by Ars Technica:
To make use of this feature, click on the Table tab for the data set you are working on and then the number column you wish to display as a bar. In the inspector on the right, you will find a Display option which can be set to Number or Bar - set it to Bar and that's it! Customization options for the bar that would be displayed will then be shown, or you can use the defaults.
Google Sites embed
We had an interesting question from a client recently about how to embed a CloudTable into Google Sites. Google Sites offers an option for embedding your HTML into a page, but if you use a <script> tag, it will always insert it into the <head> of the page. As a result we've introduced the option to specify the insert point into your document through a data-ct-insert attribute which can be added to any HTML element.
We've fully documented this process for Google Sites.
Improved linked data visualization
When selecting data points to show as columns in a table and as fields in a form, it is important to be able to understand the structure of the data at a glance. For this reason we've reworked the Column and Field selectors:
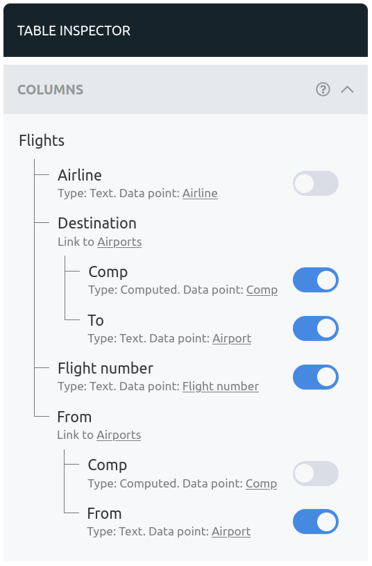
This also lays the groundwork to display multiple levels of linked data in a single table.
See our updated roadmap for what we are working on and what is coming soon.
© 2022 CloudTables designed and created by SpryMedia Ltd.
SpryMedia Ltd is registered in Scotland, company no. SC456502.
Terms of Service | Privacy Policy.